

In December 2016, CareJourney launched the Insights Workbook—a monthly executive-level review of ACO performance, with actionable metrics and data visualizations to get to increased savings. Our analytic model is firmly rooted in the questions population health leaders seek to answer and is driven by our members. By aggregating and analyzing open data, we empower our members to build strong networks and optimize care plans, boosting quality and reducing overall costs for their patients.
Insights from the Workbook Launch
While members are still orienting themselves to the Insights Workbook and ways to incorporate findings into their practices, several of our members are already reporting back on its value. We summarize a few examples below:
Focusing on high-need patients
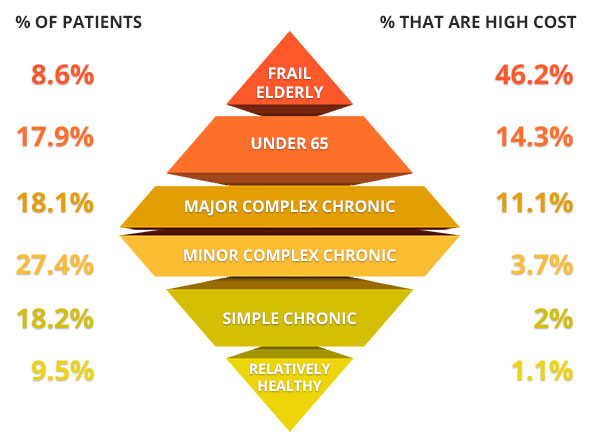
It is well known that the costliest patients represent a small percentage of the total patient population. A key strategy for increased savings is to focus on this small proportion of patients that account for the majority of spend. NavHealth utilizes open source logic from the Harvard School of Public Health and Brigham and Women’s Hospital to segment our members’ patient populations into six actionable cohorts: frail elderly; under 65 disabled or ESRD; major complex chronic; minor complex chronic; simple chronic; and relatively healthy. As shown in the diagram above, this segmentation represents a diamond shape – with the costliest segment, frail elderly, at the upper tip of the diamond and the lowest cost segment, the relatively healthy, representing the lower tip. Members are utilizing this segmentation to better understand the makeup of their attributed patients and target the riskiest patients for care management.
Executing a “narrower” network strategy
Members are harnessing the Skilled Nursing Facility (SNF) profile lists to identify SNFs with large ACO volume and then drill down into performance. For example, NavHealth’s profile lists capture open data that can help glean facilities’ operating culture regarding treatment. Some SNFs may have high therapy minute utilization, meaning the majority of the time, they bill within 10 minutes over the threshold for a higher rate. Other SNFs may have unresolved deficiencies that are considered to be serious threats to the safety of their patients. This mash up of claims data and open data is allowing our members to identify their highest volume SNFs and narrow the network by eliminating SNFs that are driving up costs and lowering quality of care for attributed patients.
Understanding the role of the PCP in the patient’s journey
Members are utilizing the referral path analysis to evaluate their progress on care coordination. While claims data do not indicate whether a referral was made, we are able to detect likely referrals through analysis of the claims data and validation via the open Physicians Shared Patient Patterns data set. Members are utilizing the analysis to understand their PCPs’ role in care coordination and are drilling down into the provider profile lists to identify specific PCPs with limited visibility into the care of their attributed patients.
Features
We are excited to announce that we launched Insights Online, which includes the following:
Insights Workbook
Members will be able to view their executive briefing books online, export to pdf, and drill-down into Guided Analysis
Performance Improvement Opportunities
Members will have access to a catalog of focused segmentation analyses on topics relevant to some, but not all, ACOs.
Guided Analysis
Profiles
Members will be able to sort and filter key metrics at the patient, physician and facility levels and export to PDF or Excel, as well as view and export to PDF individual patient profiles and physician scorecards.
Direct Self-Directed Analysis
Members with “power users” who seek a sandbox for their own analyses will have access to our analytic tools to develop custom workbooks and share them within their organization.